Fig. 2.
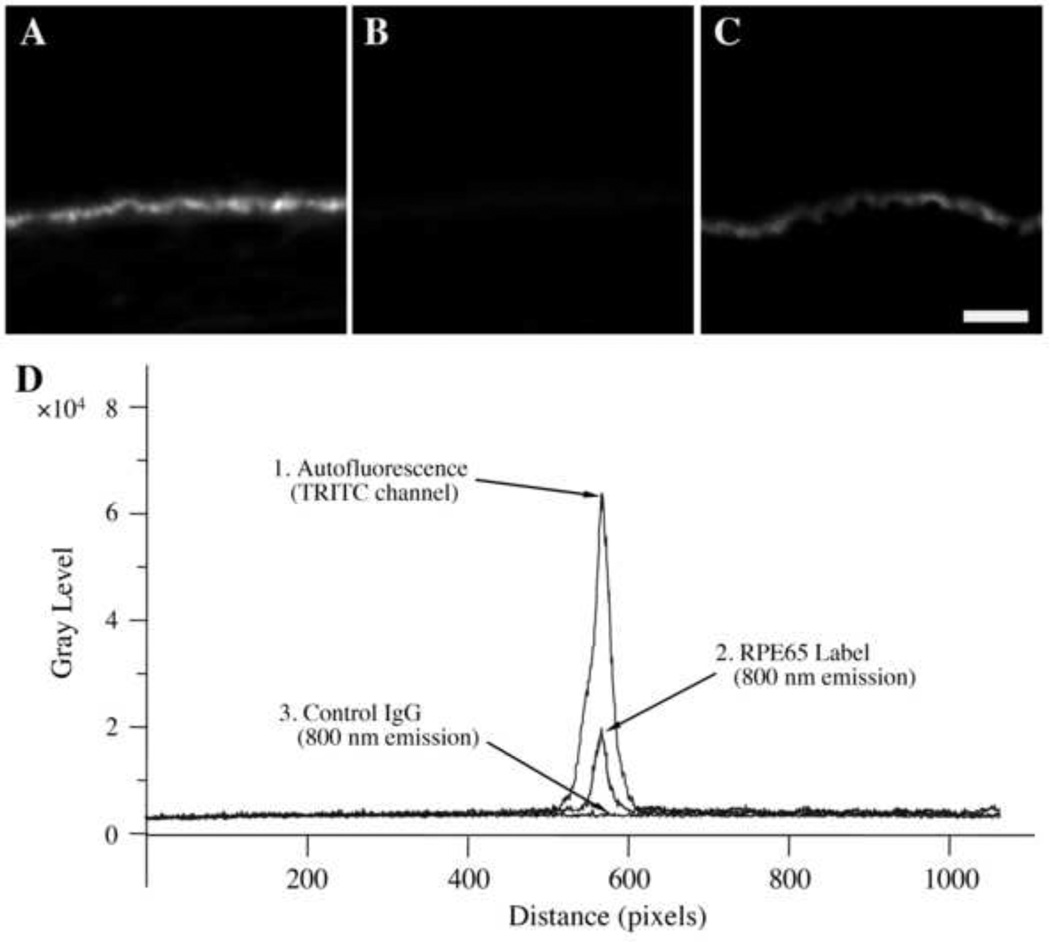
Immunofluorescence microscopy studies of human RPE/choroid sections. Panels A–C. Panels A and B show cells treated with control IgG and biotin-conjugated second-step anti-IgG followed by streptavidin-Qdot800. Panel C shows another section labeled with anti-RPE65 and biotin-conjugated second-step anti-IgG followed by streptavidin-Qdot800. In panels B and C, tissue sections were imaged using a Qdot800 filter set. In panel A, a TRITC filter set was employed. When tissue samples were examined using TRITC filters, bright autofluorescence was observed (A), as expected. Using a Qdot800 filter set the control section showed little fluorescence (B). In contrast, anti-RPE65 labeled samples demonstrated bright fluorescence localized to regions of the RPE layer (C). Unprocessed micrographs are shown. Instrument settings were identical in all of these frames to allow direct comparisons. Fluorescence micrographs were collected with camera settings of 225 EM gain, 2.4x pre-amplifier gain, and 3.0 sec. exposure. (Bar=20 m)
Panel D. Line profile analyses of images were performed to quantitatively compare fluorescence intensities of RPE layers. The intensity (grayscale) is plotted at the ordinate and position is plotted on the abscissa. The upper curve (trace 1) is the autofluorescence of unlabeled sections observed using a TRITC filter set. The lower curve is a control sample observed with the Qdot800 filter set (trace 3). The middle curve is an anti-RPE65 labeled sample (trace 2). The large Stokes shift of the Qdot800 label enables visualization at a high signal-to-noise ratio at 800 nm. The suppression of autofluorescence was noted in tissue samples from 7 patients (67 ± 7).

