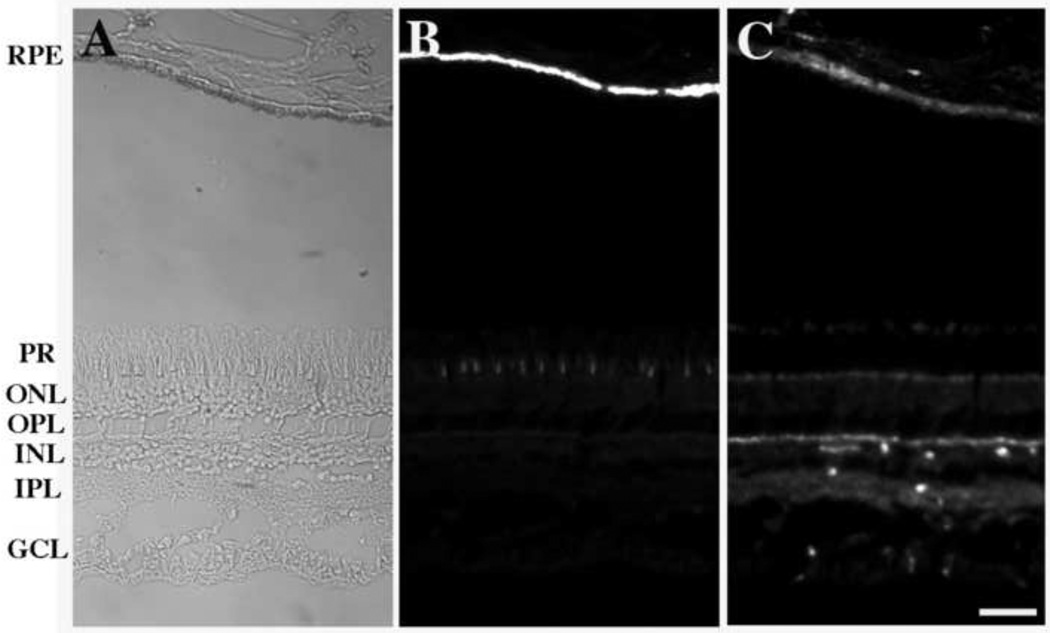
Fig. 3.
Survey micrographs of a human retina are shown. In panel A, a bright field micrograph shows the position of the RPE and neurosensory layers of the retina. Panel B shows endogenous autofluorescence observed using a TRITC filter set. On the right side, panel C shows a sample stained with an anti-β-actin antibody using a Qdot800 filter set. Note that the pattern and intensity of specific actin staining (panel C) is dramatically different than that of autofluorescence observed in panel B. (In panel A, an exposure time of 0.4 sec. was used without EM gain or pre-amplifier gain. In panels B and C, an exposure time of 1.0–3.0 sec., an EM gain of 225, and a pre-amplifier gain of 2.4x were used.) RPE, retinal pigment epithelium; PR, photoreceptor layer; ONL, outer nuclear layer; OPL, outer plexiform layer; INL, inner nuclear layer; IPL, inner plexiform layer; GCL, ganglion cell layer. (Bar = 50 µm)

