FIGURE 4.
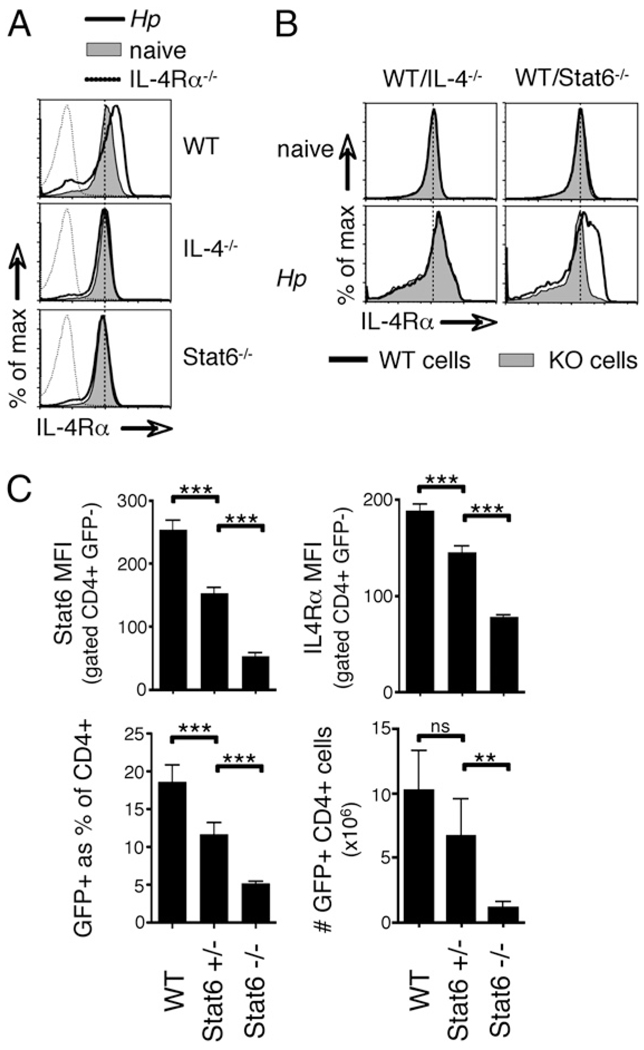
IL-4Rα upregulation in vivo is driven by IL-4 and STAT6 signaling. A, WT, STAT6−/−, and IL-4−/− mice were infected with H. polygyrus, and CD4+ cells from mesLNs were analyzed 14 d later by flow cytometry. Filled histograms indicate the staining of cells from naive mice of each genotype; solid line, H. polygyrus day 14; dashed line, cells from infected IL-4Rα−/− mice as a negative control. B, Mixed BM chimeras were generated by reconstituting CD90.1+ recipients with equal parts of CD90.1+ WT and either CD90.2+ IL-4−/− or CD90.2+ STAT6−/− BM. Reconstituted mice were infected with H. polygyrus and CD4+ cells from mesLNs analyzed 14 d later by flow cytometry. C, WT, STAT6+/−, and STAT6−/− 4get mice were infected with H. polygyrus and analyzed by flow cytometry 14 d later. The mean fluorescence of intracellular total Stat6 and surface IL-4Rα staining on bystander CD4+ GFP− cells from the mesLNs is shown, together with the total number of CD4+ GFP+ cells in the mesLNs. Error bars indicate the SD of five mice per group. Data in all of the panels are representative of two independent experiments.

