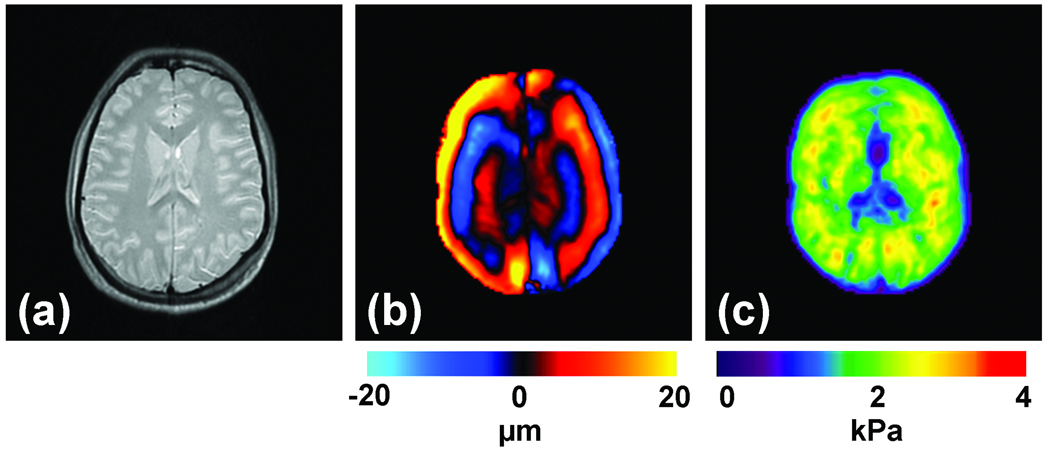
Figure 10. Brain MRE.
(a) Shown is an axial MR magnitude image of the brain showing white matter, gray matter, and cerebrospinal fluid. (b) A single wave image from MRE performed at 60 Hz. (c) The corresponding elastogram is shown and a good correlation between the magnitude image and the stiffness estimate is evident.

