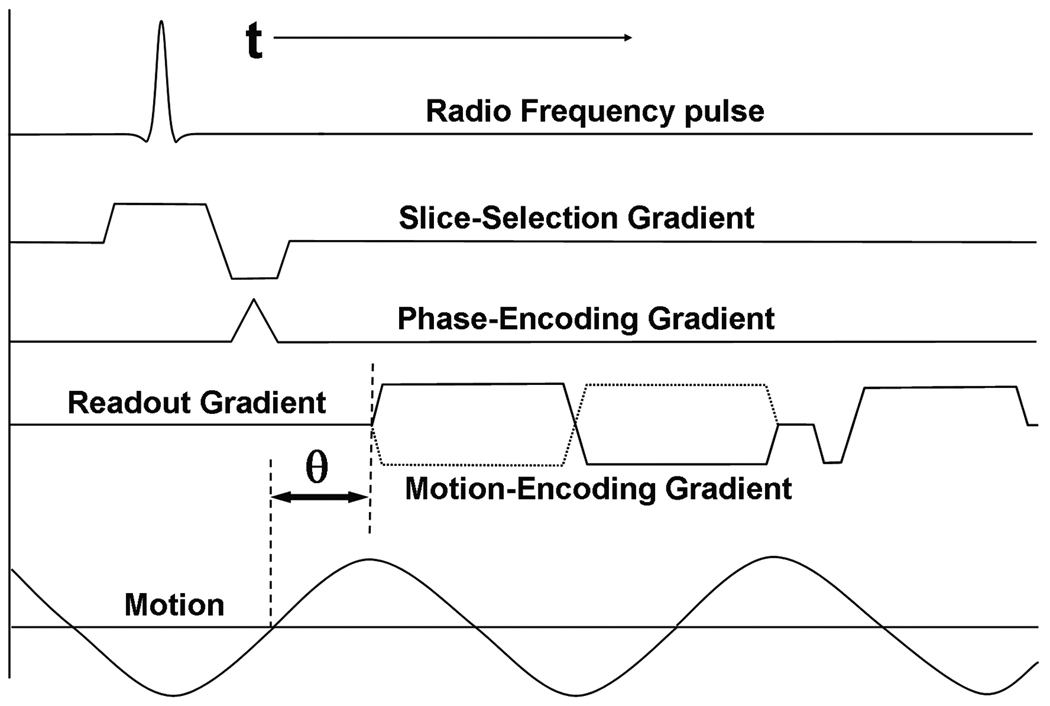
Figure 4. MRE pulse sequence.
Shown is an example of a gradient-recalled echo MRE pulse sequence diagram. A typical bipolar motion-encoding gradient (MEG) is shown (solid line) as well as the negative MEG (dotted line) used for phase-contrast imaging. The motion waveform and its temporal relationship (θ) with the MEG are also shown.

