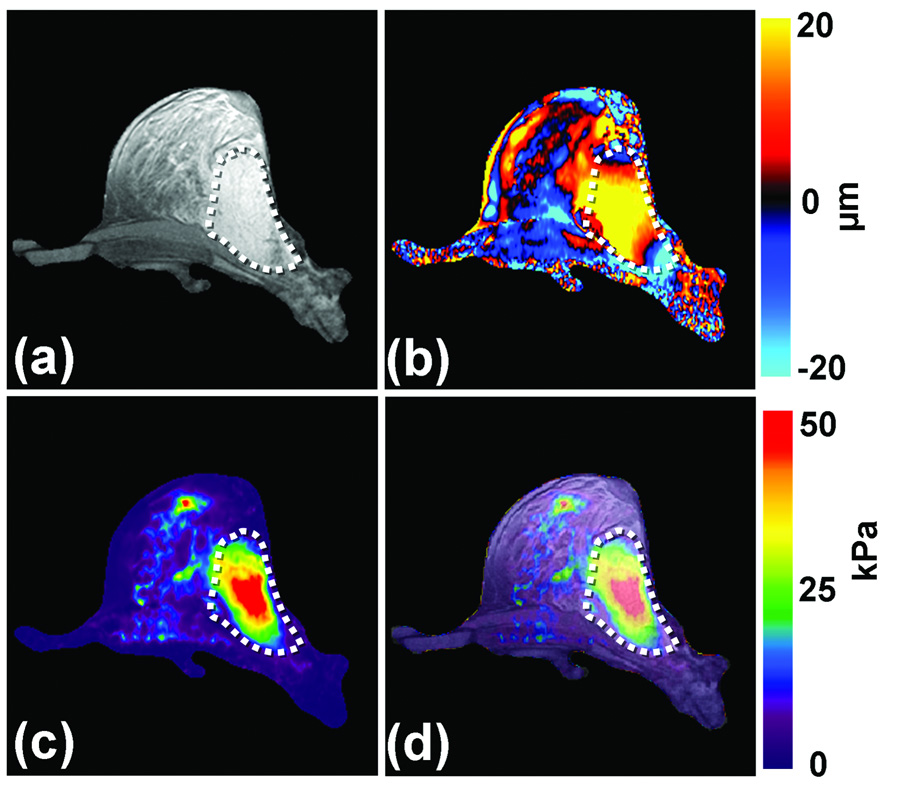
Figure 8. Breast MRE.
(a) An axial MR magnitude image of the right breast of a patient volunteer is shown. A large adenocarcinoma is shown as the outlined, mildly hyperintense region on the lateral side of the breast. (b) A single wave image from MRE performed at 100 Hz is shown along with the corresponding elastogram (c). (d) An overlay image of the elastogram and the magnitude image shows good correlation between the tumor and the stiff region detected by MRE.

