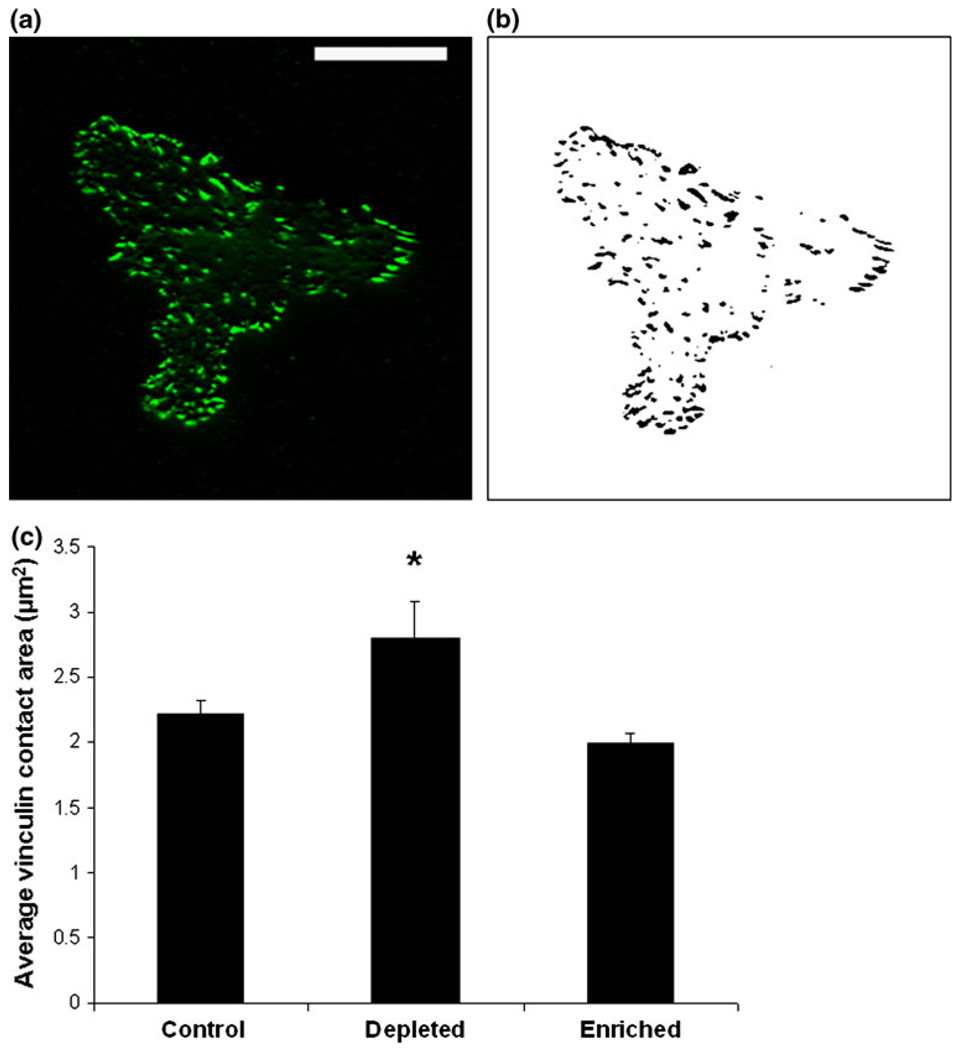
FIGURE 2.
Identification of the average vinculin contact area using total internal reflection fluorescence (TIRF) microscopy. (a) TIRF microscopy is used to identify vinculin adhesion sites close to the substrate. Scale bar is 25 µm. Binary images are created (b) and the area of each individual vinculin adhesion site is quantified. (c) The average vinculin adhesion area is significantly increased in cholesterol depleted cells compared to both control and cholesterol enriched cells (using Student’s t test with p<0.05). No significant differences occur between control and cholesterol enriched cells. Error bars represent standard error (N = 28, 26, and 25 cells for control, depleted and enriched, respectively).

