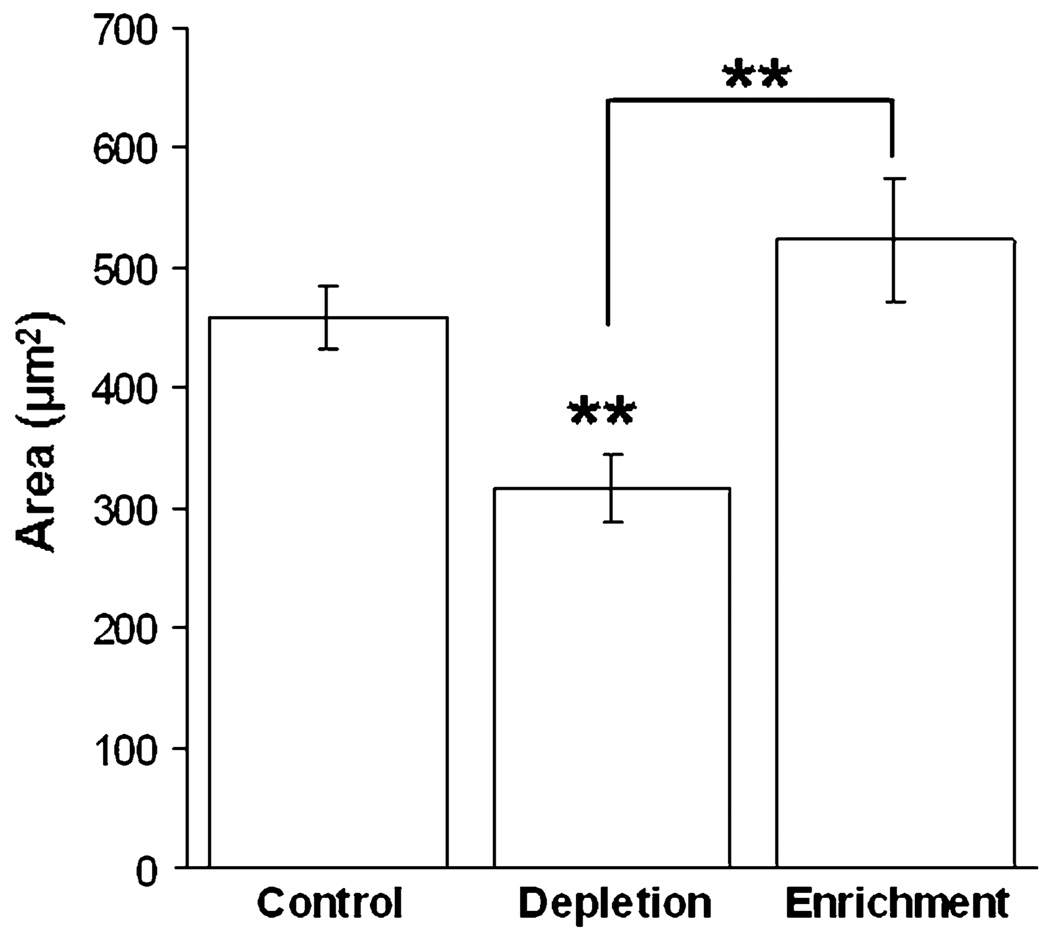
FIGURE 4.
Cells were plated onto fibronectin-coated glass bottom dishes containing control, cholesterol-depletion or cholesterol-enrichment solutions. Total spreading area was observed for untreated control cells (N = 40), cholesterol depleted (N = 60) and cholesterol enriched cells (N = 53) after 1 h of spreading using IRM. ImageJ was used to trace cell boundaries and quantify total spreading area. Error bars illustrate standard error with statistical significance reported using Student’s t test (p <0.01). Depleted cells are statistically less spread compared to control cells, while enriched cells are not statistically different.

