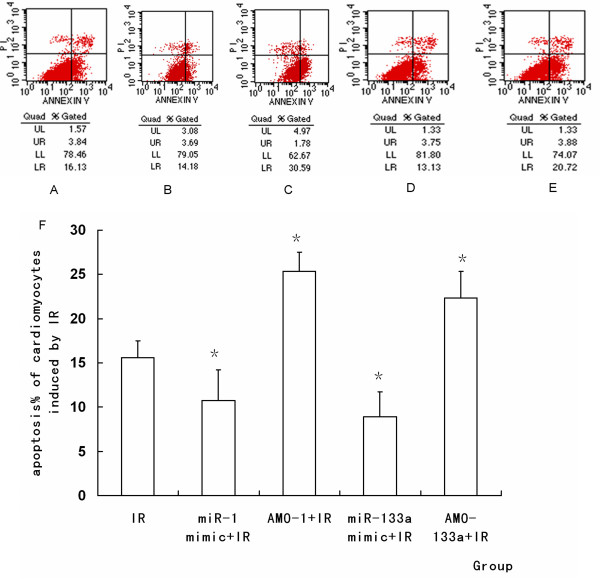
Figure 10.
Representative diagrams of the flow cytometric readings for myocardiocytes stained with annexin V and propidium iodide (PI). (A) IR. (B) miR-1 mimic+ IR. (C) AMO-1 +IR. (D) miR-133a mimic+ IR. (E) AMO-133a inhibitor +IR. (F) The percentage of apoptosis induced by IR in each group. MiR-1 promoted cell aopoptosis during IR, but miR-133a inhibited cell apoptosis during IR. (*P < 0.05, compared with IR group compared with IR group)

