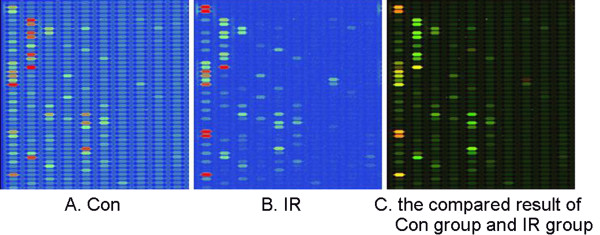
Figure 4.
MiRNA-microarray compaired between Control and IR groups. 16 miRNAs were dysregulated by IR, of which 10 miRNAs were up-regulated and the other 6 miRNAs were down-regulated significantly. The green signal is labeled with cy5 and the red signal was labeled by cy3 (green: cy3 >cy5; yellow: cy3 = cy5; red: cy3 <cy5).

