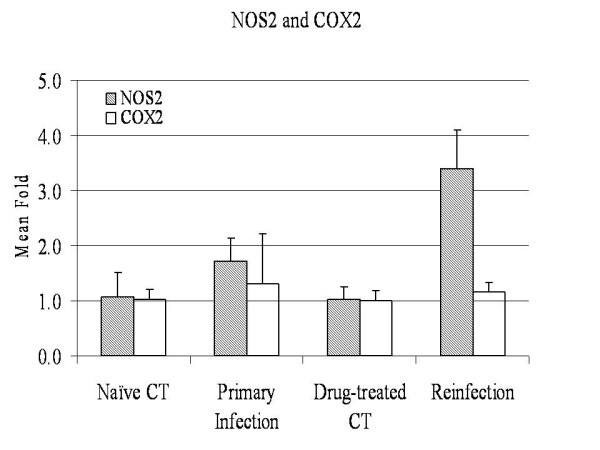
Figure 2.

The expression profiles of NOS2 and COX2 in the bovine small intestine during Cooperia oncophora infection at 14 dpi. The expression value at the mRNA level was detected using quantitative RT-PCR. The expression value of the naïve control group was set as 1.0. The fold change (N = 4) were calculated using the 2-ΔΔCT method and normalized against the naïve control group (mean ± SD). NOS 2 = nitric oxide synthase 2, inducible; COX2 = PTGS2 (prostaglandin-endoperoxide synthase 2 (prostaglandin G/H synthase and cyclooxygenase)).
