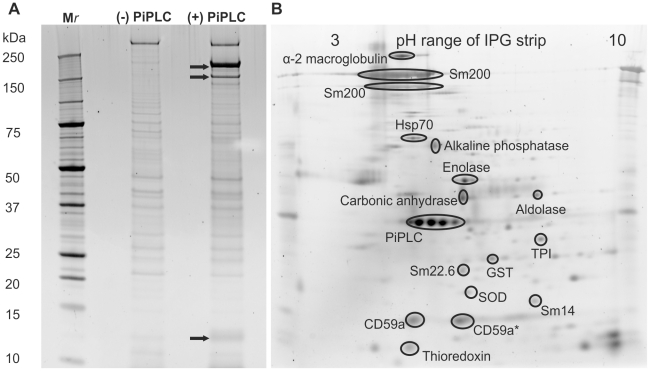
Figure 1. PiPLC-released proteins analysed by 1-DE and 2-DE.
(A) Ten µg of proteins present in the culture supernatant +/− PiPLC were separated by 1-DE and the gel stained with SYPRO Ruby. The majority of the proteins were shared between the PiPLC-treated and non-treated samples. Only three bands (arrowed) were visibly enriched by the treatment, two of high molecular mass at approx. 200 kDa and a third at approx. 12 kDa. (B) Fifty µg of proteins present on the PiPLC- treated supernatant were separated by 2-DE and the gel stained in SYPRO Ruby. Labelled spots are those identified by mass spectrometry after Coomassie staining of the gel. The PiPLC protein cluster on the 2-DE map does not correlate with the same levels of PiPLC used for preparation of 1-DE gels as they were from different sources and exhibited differing specific activities. *Less acidic CD59 isoform, see Table S3 for peptide identification data.

