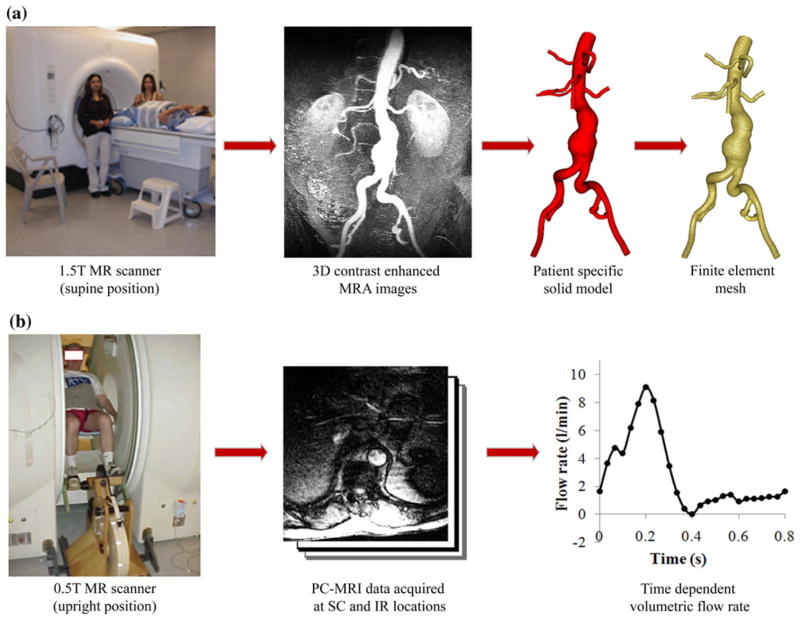
FIGURE 1.
Data acquisition using magnetic resonance imaging (MRI). (a) AAA subjects were scanned in the supine position using a 1.5 T Signa MR scanner (GE Medical Systems, Milwaukee WI) to image the lumen of the abdominal aorta using a 3D gadolinium-enhanced magnetic resonance angiography (MRA) sequence. These images were processed using custom software42 to generate a 3D solid model and a finite element mesh (MeshSim™, Simmetrix, Clifton Park, NY). (b) Next, each subject was scanned in the upright position using a 0.5 T Signa MR scanner (GE Medical Systems, Milwaukee WI) and acquired cine phasecontrast MRI (PC-MRI) data at supraceliac (SC) and infrarenal (IR) locations. PC-MRI data were collected under resting conditions and during lower limb exercise conditions on a custom MR-compatible cycle.5 We used the PC-MRI images acquired during resting conditions herein, and extracted the time-dependent volumetric flow rate at each location with 24 time points over the cardiac cycle.

