
Fig. 2.
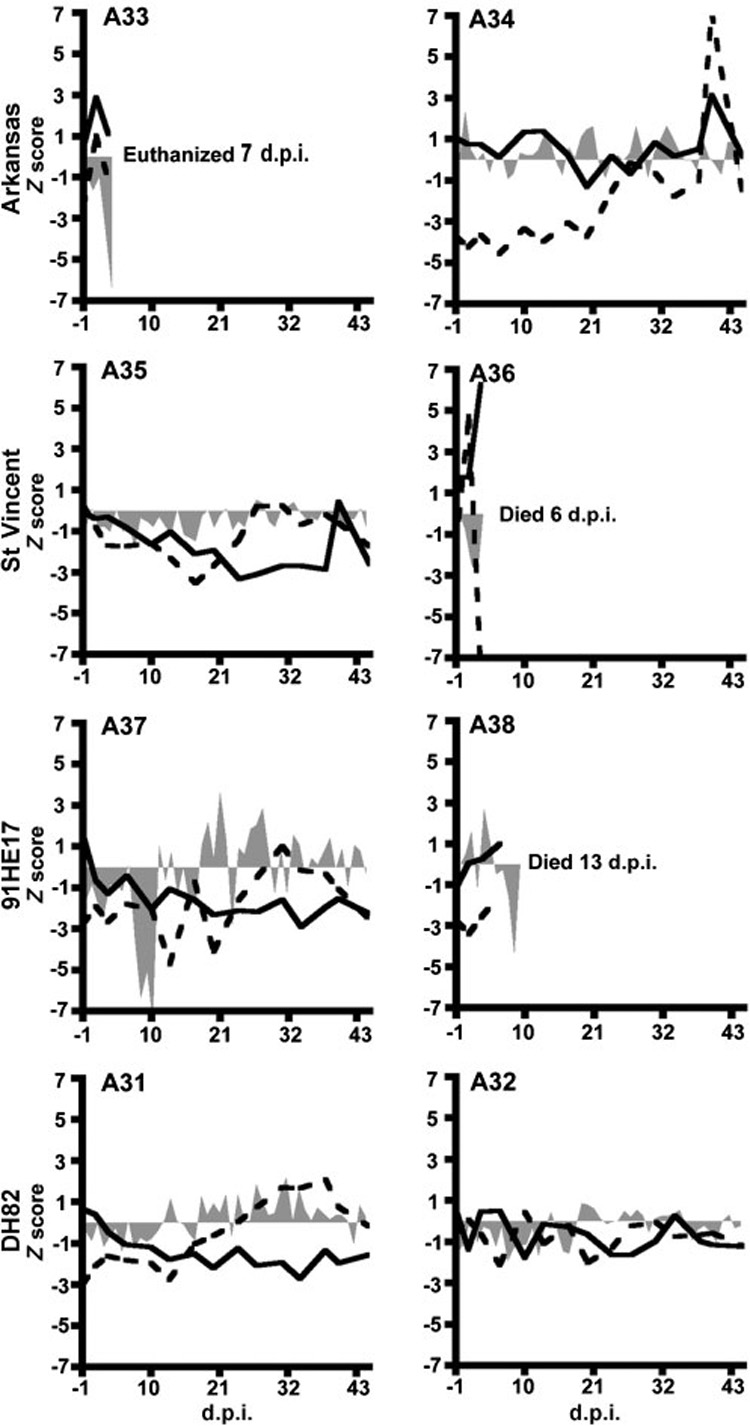
Clinical observations of calves after inoculation with active cultures of different E. chaffeensis strains. Z scores were calculated and plotted for body temperatures (shaded areas), peripheral platelets (dashed lines) and leukocytes (solid lines), as described in the text. Top, second and third rows represent calves inoculated with the Arkansas, St Vincent and 91HE17 strains, respectively. The bottom row represents negative controls.