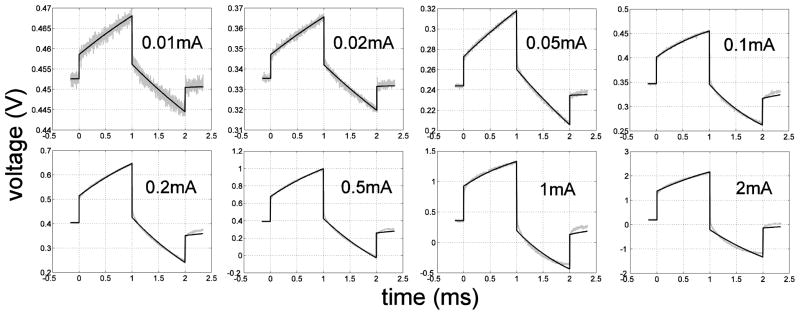
Figure 6.
In vivo voltage responses (grey) to symmetrical biphasic square currents (1 ms per phase) at different amplitudes between 0.01 mA and 2 mA, and the least-square curve fits (black) to the voltage responses. The correlation coefficients (r2) are 0.990, 0.994, 0.996, 0.996, 0.996, 0.996, 0.994 and 0.994 respectively from 0.01 mA to 2 mA. Open circuit potential was 0.34 ± 0.14 V (n=36, 4 contacts×9 amplitudes) in vitro and 0.38 ± 0.23 V (n=96, 4 contacts×8 amplitudes×3 cats) in vivo.

