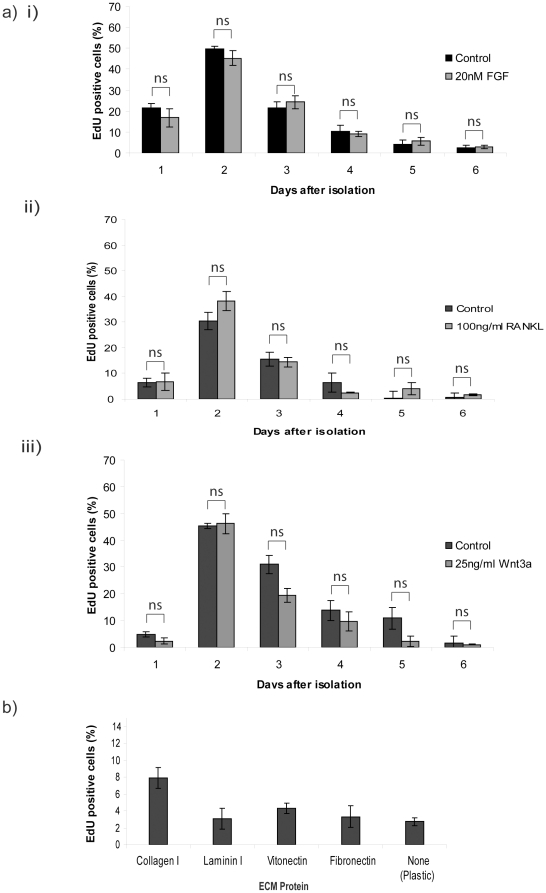
Figure 2. Proliferation is not enhanced or extended by mammary gland growth factors or different ECM proteins.
(a) MECs were treated with (i) FGF, (ii) RANKL, and (iii) Wnt3a at the time of plating for the duration of culturing, and the proliferation was determined each day over 6-d. In each case, statistical analysis in control and growth factor treated MECs was compared by ANOVA. The pairs of samples were found to be not significantly different (ns). At each time point, the difference in %EdU-positive cells was compared to that at day-2 (i.e. the maximum), and found to be significant, p<0.001 (not shown on the graphs). (b) MECs were plated on dishes coated with collagen I, laminin, vitronectin, fibronectin, or on plastic, and proliferation was determined 4-d after plating. The difference in %EdU-positive cells between collagen and the other substrata was: plastic p<0.001; vitronectin p<0.01; laminin and fibronectin p<0.1 (not shown on graph).

