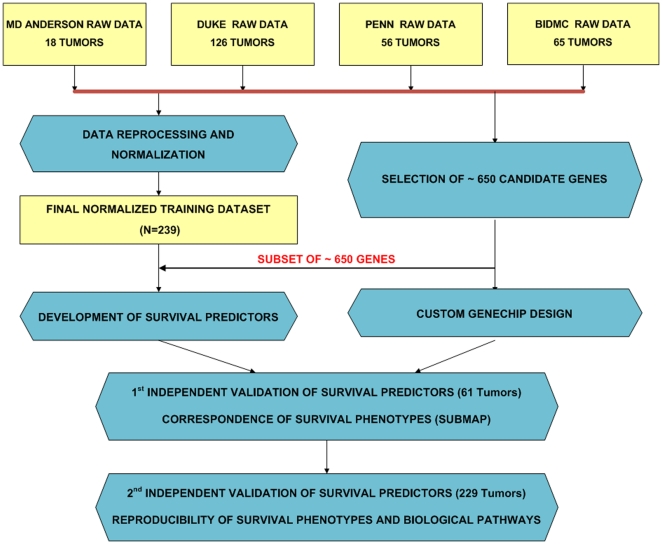
Figure 1. Consort Diagram (Study work flow).
Raw data (Affymetrix .CEL files) from four previously reported microarray datasets from different institutions were used. Outlier samples were excluded and batch effect was adjusted resulting in the final training set (239 arrays). 650 genes were selected by performing survival analysis in each dataset and were used to develop prognostic models in the final training set. Data pre-processing (quality control and batch adjustment) and normalization resulting in an integrated training set was done separately from the selection of 650 genes, which were chosen independently by performing survival analysis in each of the 4 datasets (MD ANDERSON, PENN, DUKE, BIDMC). These preselected 650 genes were then used to develop prognostic models in the unified training set. These models were independently validated in two independent datasets: a 61-tumor cohort using a custom array containing the 650 preselected genes and a 229-tumor recently published ovarian cancer microarray dataset. The correspondence of the low- and high-risk phenotypes was assessed using SubMap.

