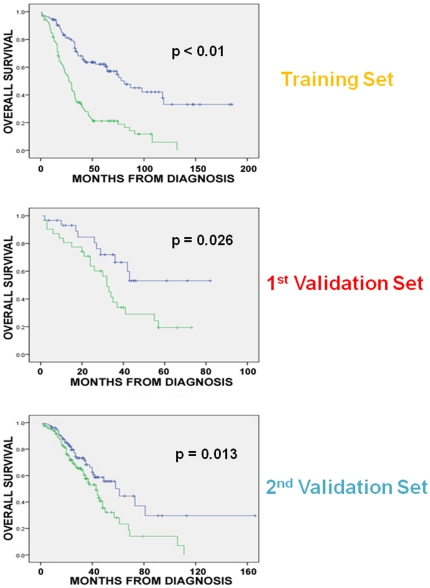
Figure 3. Association between 19-gene model and overall survival in the training and validation sets.
The 19-gene model distinguished between a high and a low-risk group in the training set with a median OS of 31 months and 78 months respectively (log rank p<0.01, permutation p = 0.02), a high and a low-risk group for OS in the 1st validation set (median OS 32 months versus not-yet-reached respectively, log rank p = 0.026), and a high and a low-risk group for OS in the 2nd validation set (median OS 43 months versus 61 months respectively, log rank p = 0.013).

