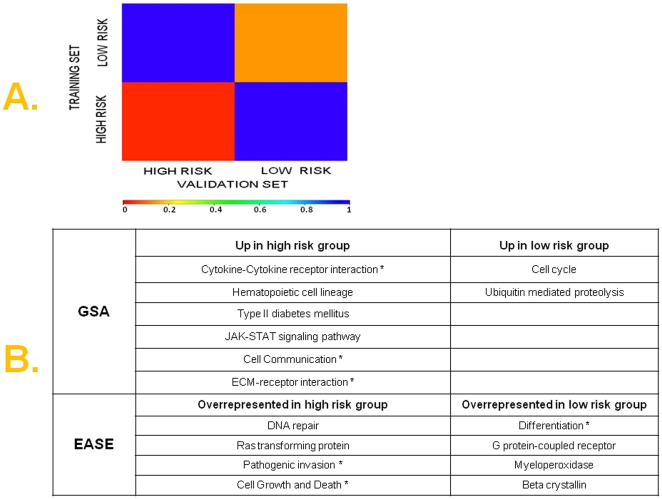
Figure 5. A) Genome-wide molecular correspondence of high and low-risk groups between training and 1st validation set.
SubMap analysis of genome-wide correspondence (similarity) between respective high and low risks groups in the training and 1st validation set. The legend shows the relationship between color and FDR-adjusted p-values. Red color denotes high confidence for correspondence; blue color denotes lack of correspondence (Table S1). B) Functional gene set analysis and functional representational analysis in high and low-risk disease samples. Gene set analysis (GSA) over a wide range of differentially expressed genes revealed 8 pathways that were consistently statistically significantly differentially expressed. (Efron-Tibshirani GSA, p<0.05). Selected pathways-gene sets are shown that were overrepresented among high-risk and low-risk tumors by functional representational analysis using EASE (within-system FDR ≤0.01). A full list of these pathways is found in Tables S2, S3 and S4. Asterisks (*) denote pathways that were similarly expressed in corresponding prognostic groups in the 2nd validation set.

