
Figure 1.
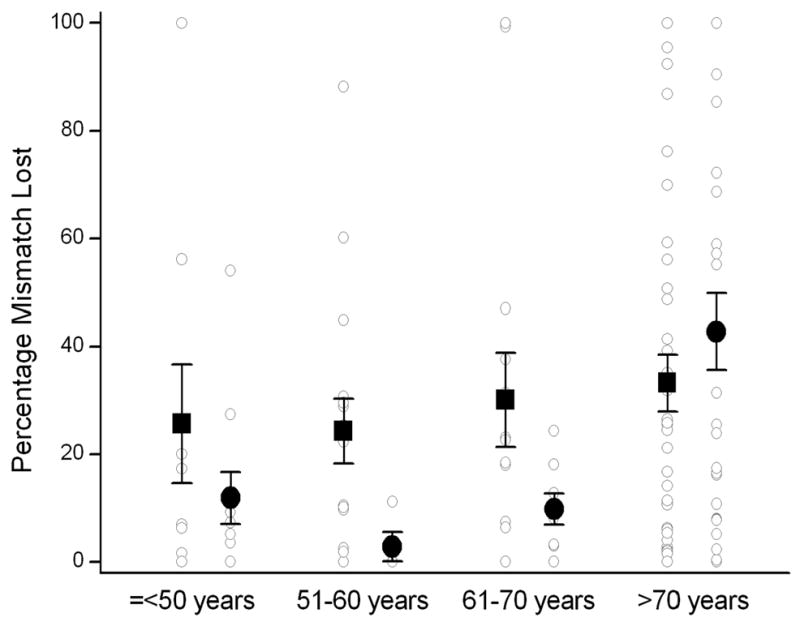
Percentage mismatch lost as a function of age and gender. The graph shows the individual data points (○), mean percentage mismatch lost for each age group (■: men; ●: women) and the corresponding standard error bars. Note that percentage mismatch lost is less in women compared to men among patients ≤70 years old, while there is no difference in percentage mismatch lost between men and women >70 years old.