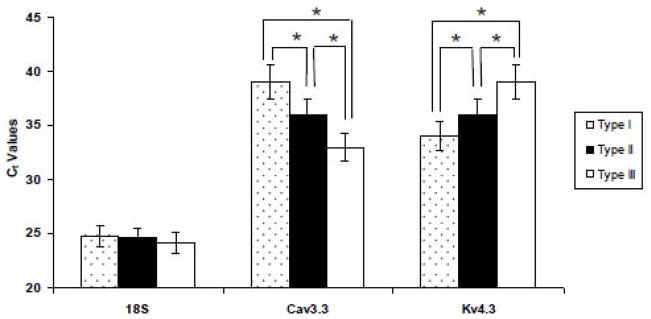
Figure 4.
Real-time RT-PCR measures Cav3.3 and Kv4.3 subunits in BNSTALG neurons (Type I-III). Mean Ct values for Cav3.3 subunit in BNSTALG neurons are Type I (39±0.35), Type II (36±0.23) and Type III (33±0.15). The Ct values are significant among each other at *P<0.0001. Similarly, for Kv4.3, the Ct values are significant (*P<0.0001) for Type I (34±0.27), Type II (36±0.12) and Type III (39±0.21). The Ct values of reference gene 18S rRNA among three neurons are (Type I= 24.8±0.21; Type II= 24.6±0.29 and Type III=24.2±0.19)

