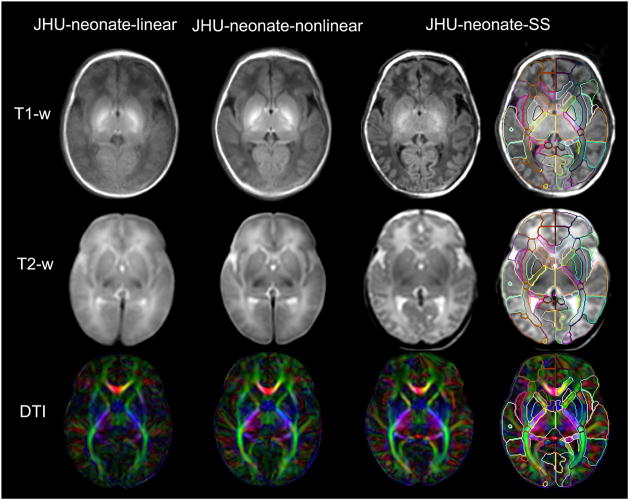
Figure 2.
Multi-contrast atlases created in this study. The upper row shows a T1-weighted atlas, the middle row shows a T2-weighted atlas, and the lower row shows a DTI atlas (color-coded orientation map of the diffusion anisotropy were used as the representative image). The JHU-neonate-linear atlas (the leftmost column) represents the average size and shape of the twenty images used to create the template. The sharpness of the edge of each brain structure seen in the JHU-neonate-nonlinear atlas (the column next to the linear template) indicates that the LDDMM transformation was fairly accurate. The JHU-neonate-SS atlas (the rightmost two columns; right column with the parcellation map) was used as a template for the normalization using LDDMM.

