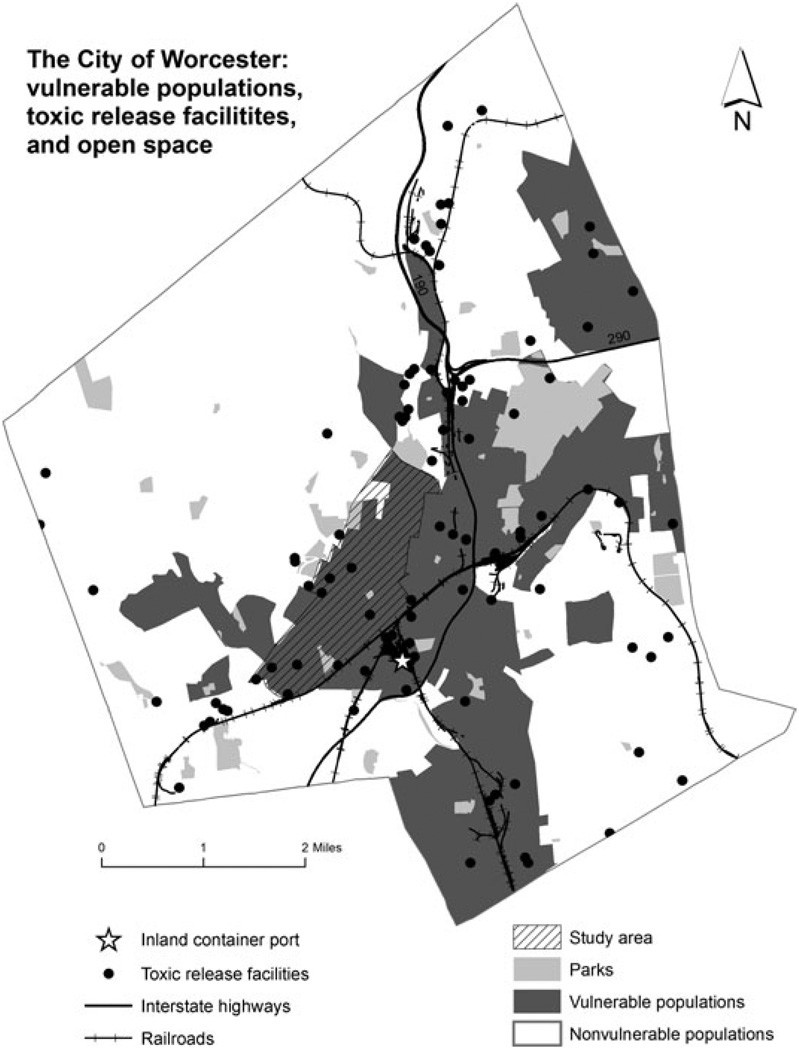
Fig. 1.
Study area in Worcester City. Shows paucity of green space, toxics release inventory (TRI) sites (2006 data), and roads. Vulnerable groups are designated as “environmental-justice populations” according to U.S. Census socioeconomic data.(6) Map prepared by Yelena Ogneva-Himmelberger. From Ref. 5, used by permission of Elsevier Ltd.

