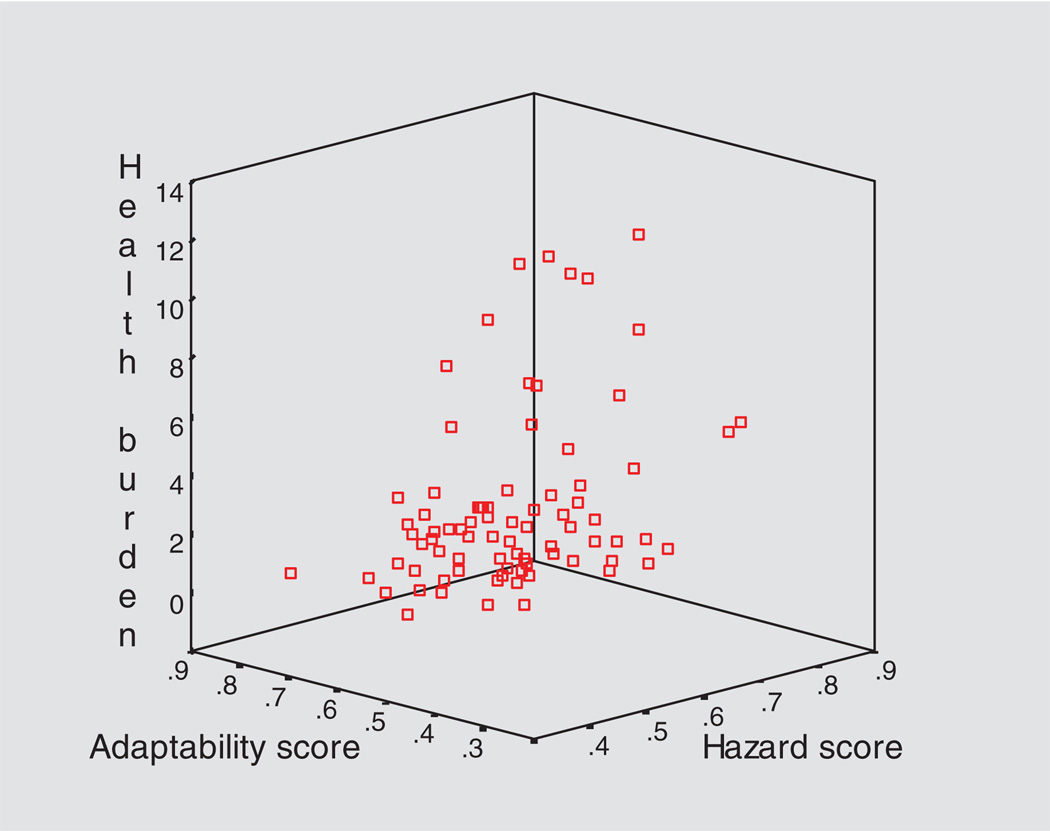
Fig. 8.
Household health burden versus vulnerability. Shows health burden (HB) as a function of standardized adaptation index (A) and hazard (H) index scores (0.0–1.0, 1.0 being maximum hazard score, or max. adaptability) for 80 randomly sampled households. HB is the average number of self-reported problems per household member, from a set of 21 problems (Table VI). The plot shows logical but weak associations worthy of further research (linear regression: HB = −11.46A + 1.42H + 8.62; r2 = 0.161, SE = 2.865).

