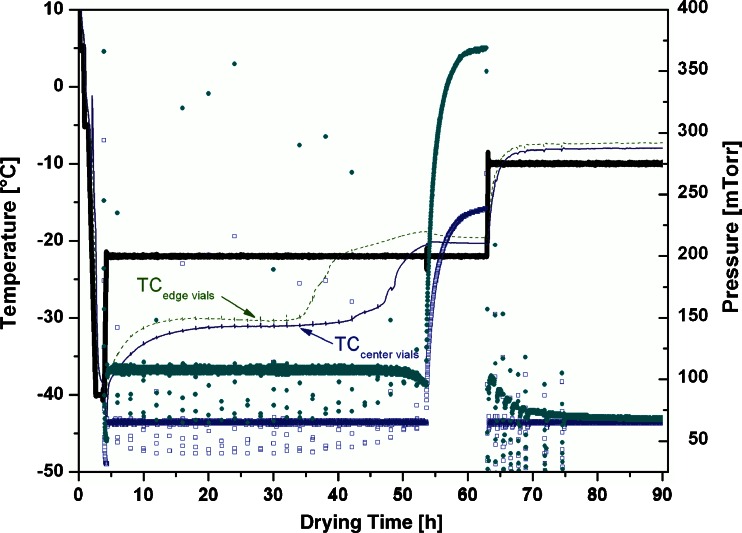
Fig. 2.
Isothermal secondary drying experiment (T s = −10°C) including equilibration step. Thick solid line, shelf inlet temperature (T s); thin dotted line, average thermocouple temperature (edge vials); thin solid line, average thermocouple temperature (center vials); open squares, chamber pressure (CM); filled circles, Pirani signal

