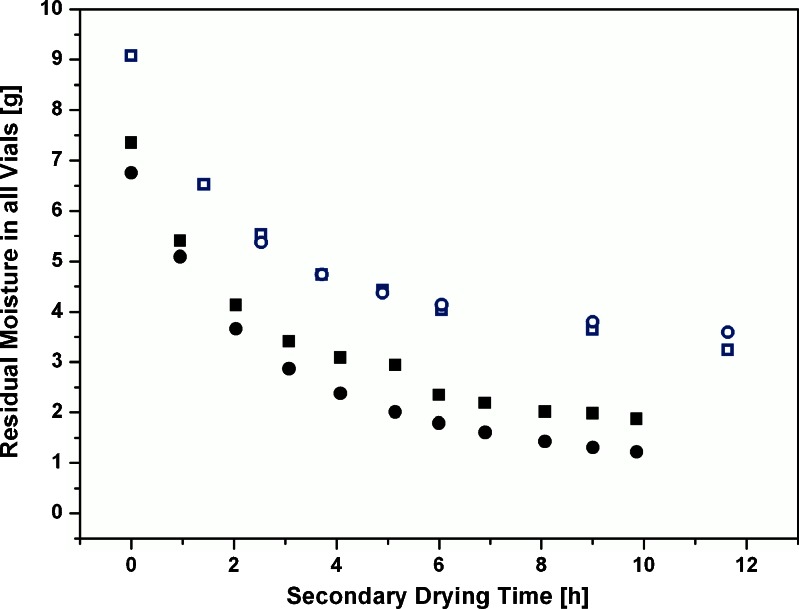
Fig. 9.
Comparison of residual moisture measured by Karl Fischer from sampled vials to mass flow integration from TDLAS measurements at −10°C and 0°C. Open squares, residual moisture by Karl Fischer (−10°C); open circles, residual moisture calculated by TDLAS (−10°C); filled squares, residual moisture by Karl Fischer (0°C); filled circles, residual moisture calculated by TDLAS (0°C)

