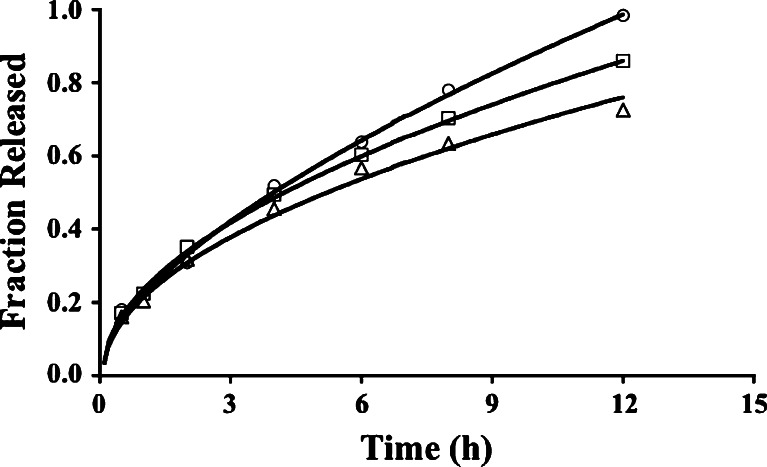
Fig. 5.
Release profiles for tablets from PGX1 (circles), PGX2 (squares), and PGX3 (triangles) batches. The curves reveal the fit of the Diffusion and Erosion model to PGX1 data, the Peppas equation (Eq. 7) to PGX2 data, and the Higuchi model to PGX3 data

