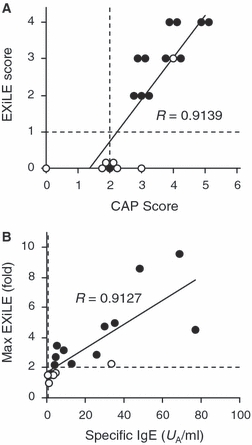
Figure 5.

Correlation between CAP test and IgE crosslinking–induced luciferase expression (EXiLE) test. Results in Table 1 are depicted in graphic form. Correlation between CAP classes and EXiLE scores (A), and that of allergen-specific IgE concentration and Max EXiLE (B) are shown. Closed and open circles, subjects from oral food challenge positive and negative, respectively. Vertical and horizontal dashed lines, cut-off levels of the CAP and EXiLE test, respectively. R-values of Spearman's rank correlation test were 0.9139 (P < 0.001) in A, and 0.9127 (P < 0.001) in B.
