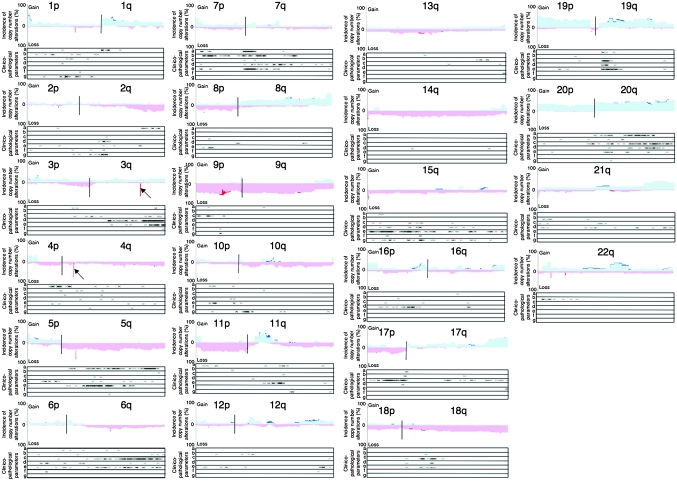
Fig. 2.
Copy number alterations and their clinicopathological impacts in UCs. The incidence of copy number alterations on chromosomes 1–22 in UCs (T1 to T49) is shown. Gains (copy number: ≥3) and losses (copy number: 1 or 0) are shown in the upper and lower halves, respectively. Copy numbers of 0, 1, 3 and more are shown in dark red, light red, light blue and dark blue, respectively. The homozygously deleted regions on 3q26.1 and 4q13.2 are indicated by arrows. Locations of the array CGH probe on which copy number alterations were significantly correlated (unpaired T-test with Bonferroni correction, P < 0.00714) with histological grade (a), depth of invasion (b), lymph vessel involvement (c), vascular involvement (d), tumor configuration (papillary versus non-papillary, (e) lymph node metastasis (f) and recurrence (g) of UCs are indicated by ‘X’ under each of the histograms for chromosomes 1–22.

