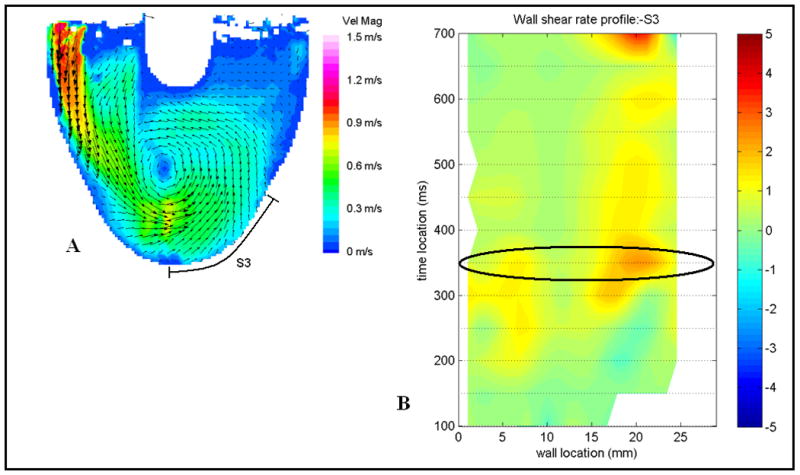
Figure 5.

An example of a flow map (A) and the corresponding wall shear rate map (B). The section highlighted and labeled S3 is the surface shown in the wall shear map in B. An example wall shear rate (profile B) where positive shear is defined in the clockwise direction and negative shear is in the counter-clockwise direction. The oval highlights the time step shown in the flow map A. The shear rate is normalized by the threshold shear of 500 s-1, so that 1 to -1 on the shear map is equivalent to 500 s-1 to -500 s-1.
