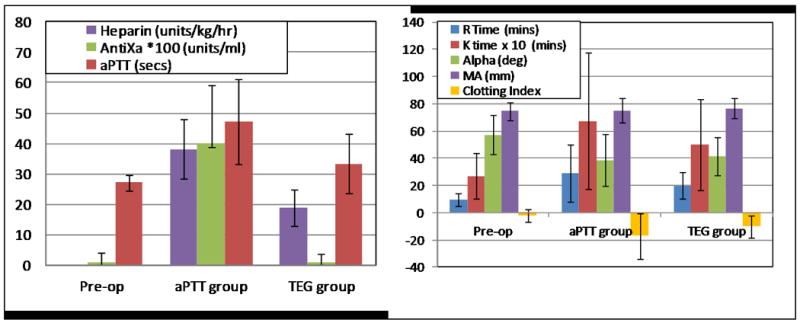
Figure 6.

Left: The heparin dose in the TEG group (reduced heparin protocol) was approximately one half that of the aPTT group, and circulating heparin (antifactor Xa) was barely detectable in the TEG group. The aPTT and TEG groups were significantly different (p < .001) for the 3 parameters shown. Antifactor Xa in the TEG group was not significantly different than pre-op levels. Right:TEG R, K, and clotting index were statistically different (p < .001) between the aPTT and TEG groups.
