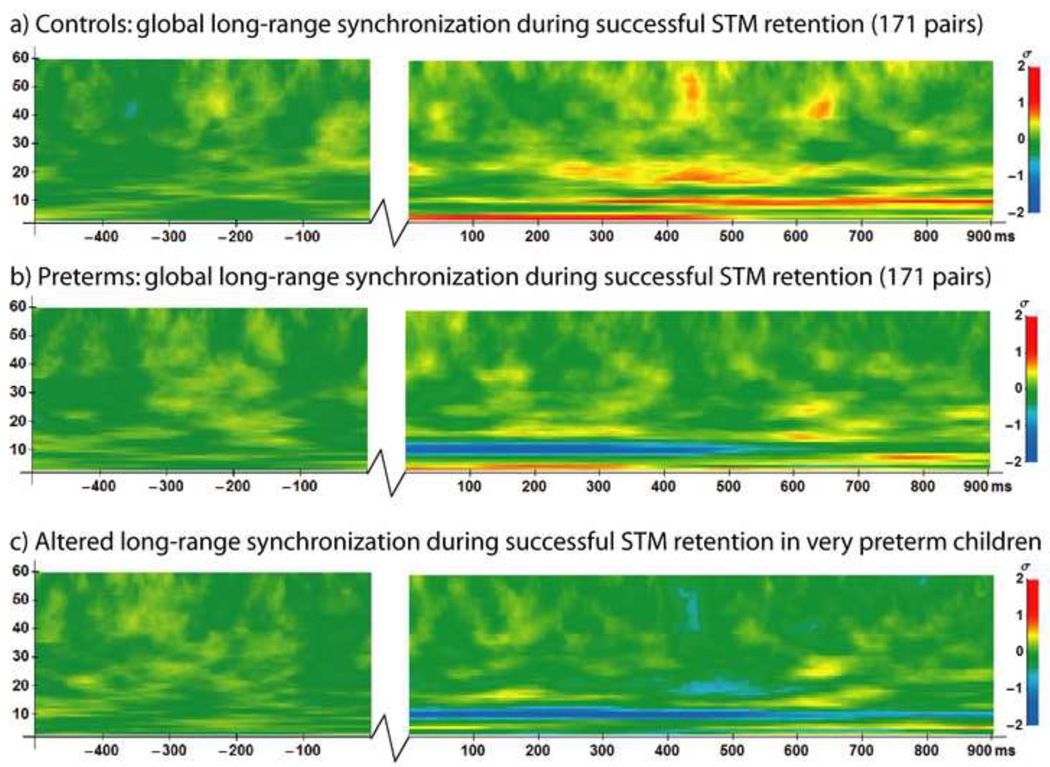
Figure 2.
Time-frequency plots of global long-range synchronization during the 500 ms baseline period preceding the onset of the first stimulus (−500 to 0 ms) and during the 900 ms STM retention interval between the first and second stimuli (0 to 900 ms) on correct trials. Jagged lines indicate temporal discontinuity (time period between baseline and retention interval). a) Normative pattern of long-range synchronization during successful visual STM retention in 12 full-term controls. b) Long-range synchronization on correct trials in the matched group of 12 very preterm children. c) Group differences in global long-range phase synchronization, where blue represents reduced synchronization in 12 matched preterm children relative to controls during successful visual STM retention, and yellow/red represents increased synchronization in preterm children relative to controls. Legends at right.

