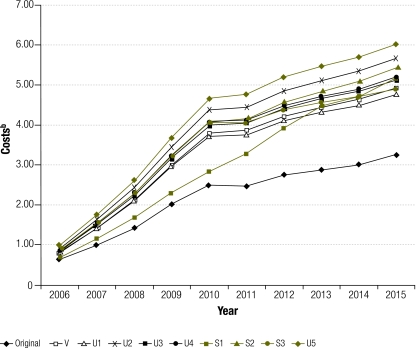
Fig. 2.
Scale-up curves comparing original costs to revised cost estimates for intervention package,a for 26 respondent countries
S, sensitivity analyses; U, information updates; V, validation.
a Of the World Health Organization’s Department of Child and Adolescent Health and Development.
b In billions of 2004 United States dollars.

