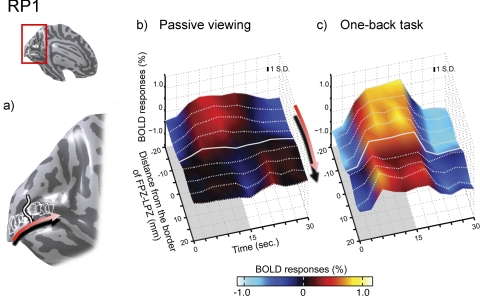
Figure 3.
Single-cycle average BOLD time series within calcarine sulcus in subject RP1. (a) Nine circular ROIs (5-mm radius) were chosen in the calcarine sulcus of each hemisphere. The middle ROI in each hemisphere was centered on the LPZ-FPZ border; four ROIs were placed anterior and four posterior. Red arrow: ROIs are ordered from posterior to anterior. (b) Surface plot of the average single-cycle BOLD time series in the passive viewing condition. The solid and dotted white lines are the time series from each of the nine ROIs. The stimulus was presented in the first half of the cycle and replaced by a uniform field in the second half. Red arrow: ROI ordering. The solid white line is from the LPZ-FPZ border. The gray shaded area indicates the period when the stimulus is “on.” In the FPZ, the responses increase and decrease in phase with the stimulus (positive response). In the LPZ, anterior to the border, the response is out of phase with the stimulus (negative response). (c) In the OBT, the LPZ responses change from negative to positive. Inflated cortical surface of the left hemisphere of the subject (inset, upper left). Typical ±1 SD for a response point is inset within the figure. Colors indicate the BOLD percent modulation around the mean response.

