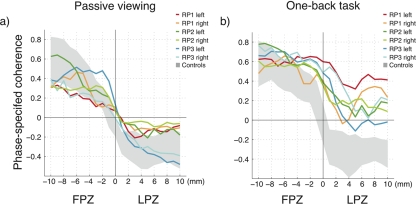
Figure 6.
Phase-specified coherence as a function of distance from the FPZ-LPZ border. The six curves show data separately from the left and right hemispheres of the three RP subjects. Gray-shaded area: range of responses from the controls. Phase-specified coherence is pooled into 1-mm bins. (a) In the passive viewing condition, there is reasonable agreement between the RP and control responses. (b) In the OBT condition, the RP responses in the LPZ are significantly elevated. Further statistical analyses of these data are given in Supplementary Figure S1.

