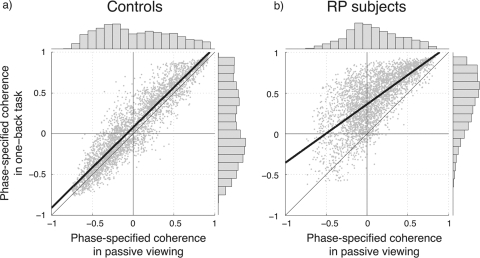
Figure 7.
Phase-specified coherence with the stimuli compared in passive viewing and OBT conditions. Each point shows the phase-specified response of a voxel in one of the calcarine ROIs in the passive (x-axis) and OBT (y-axis) conditions. (a) For the two control subjects, the points fall near the identity line, showing that the responses are nearly invariant across the two conditions. (b) For the RP subjects, the negative BOLD responses in the passive-viewing condition become more positive in the OBT condition. In other words, the out-of-phase voxels in passive viewing turn to in-phase to the visual stimuli in OBT. Histograms showing the marginal distributions of the coherence values for passive and one-back conditions are plotted at the upper and right edges of the graphs. There is no significant difference between the distributions except for the OBT condition in RP subjects. Heavy solid lines: best linear-fit to the data; thin line: identity line. Definition of ROI is same as in Figure 6.

