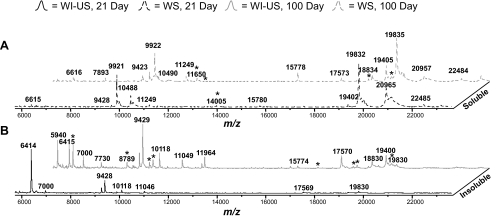
Figure 6.
Broad-range (6,000–23,000 Da) MALDI-TOF spectra showing the water-solubility characteristics of the (A) WS and (B) WI-US fraction. WI-US fractions are indicated by solid lines; WS fractions are indicated by dashed lines: 21-day ICR/f (black) and 100-day (gray) ICR/f rat lens homogenate. *Novel peaks detected between the compared spectra.

