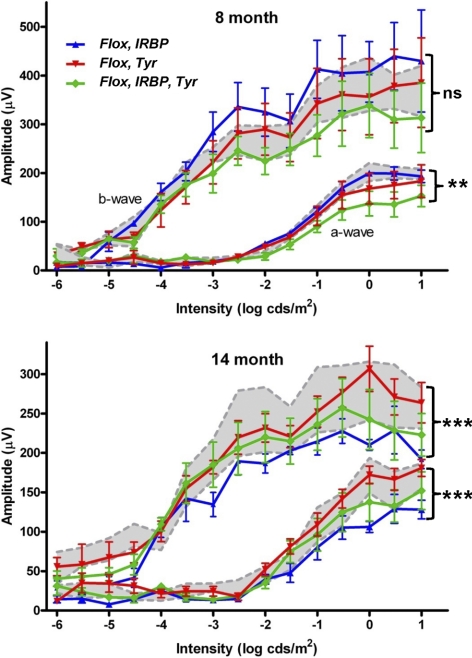
Figure 5.
Quantification of the amplitude of the major components (a- and b-wave) of the dark-adapted ERG across a range of stimulus intensity. Two groups of animals (8-month- and 14-month-old) were studied. Numbers of 8-month-old animals were: ChmFlox, Tyr-Cre+ (n = 5); ChmFlox, IRBP-Cre+ (n = 3); ChmFlox, Tyr-Cre+, IRBP-Cre+ (n = 5), and ChmFlox (n = 4). Numbers of 14-month-old animals were: ChmFlox, Tyr-Cre+ (n = 6); ChmFlox, IRBP-Cre+ (n = 5); ChmFlox, Tyr-Cre+, IRBP-Cre+ (n = 6), and ChmFlox (n = 6). All genotypes are shown on each graph: ChmFlox, Tyr-Cre+ (red line), ChmFlox, IRBP-Cre+ (blue line), ChmFlox, IRBP-Cre+, Tyr-Cre+ (green line). Mean amplitudes ± SEM are plotted. Values for control animals (ChmFlox, mean ± SEM) are indicated by gray shading.

