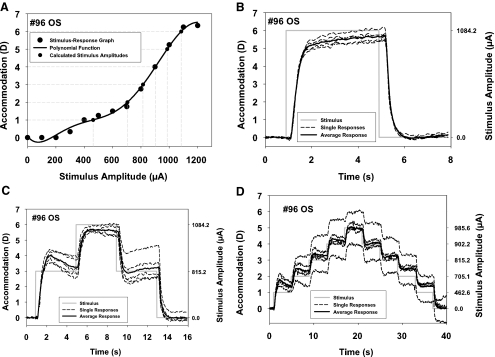
Figure 1.
(A) Example of a stimulus–response curve (monkey 96) with the polynomial function (equation: y = 5.0560 × 10−17x6 − 2.3096 × 10−13x5 + 3.8076 × 10−10x4 − 2.7989 × 10−7x3 + 9.4723 × 10−5x2 − 1.0101 × 10⁻²x + 7.0795 × 10⁻²; r2 = 0.996) used to calculate stimulus amplitudes for accommodative responses in 1-D steps (gray dashed lines originating on the y-axis). (B) Example of a 6-D, 4-second step stimulus and the responses as a function of time. (C) Example of a 3-D, 6-D, 3-D, three-step stimulus and the responses as a function of time. (D) Example of a staircase stimulus with five successive incrementing and five successive decrementing 1-D steps and the responses as a function of time. In each graph, the stimulus is shown as a solid gray line. On the right y-axis, the corresponding stimulus amplitudes calculated from the polynomial function in (A) are shown. Dashed lines: five individual, consecutive responses. Solid line: the average of these five responses. The individual responses show various amplitudes and the average falls close to the intended amplitude.

