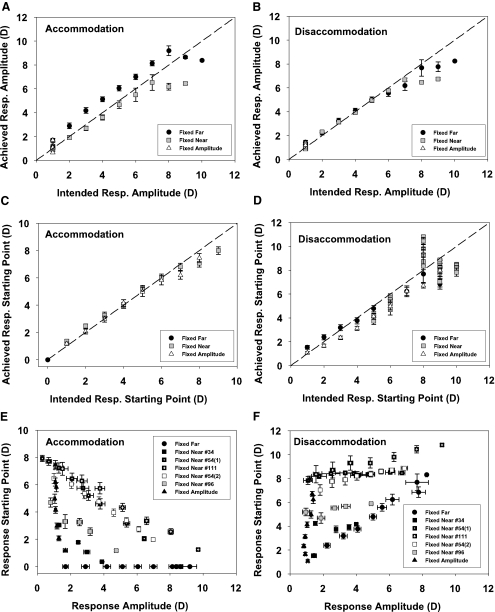
Figure 2.
Relationships between intended and achieved amplitudes of accommodation (A) and disaccommodation (B) and intended and achieved starting points of accommodation (C) and disaccommodation (D) for the three conditions are shown. The error bars, ±SEM (E) and (F) show the accommodative and disaccommodative amplitudes plotted against the starting point. For the fixed near condition, the experiments are plotted separately, because a different near point was used in each experiment. The average response amplitude of accommodation and disaccommodation in the fixed-amplitude condition was about the same for proximal and distal starting points.

