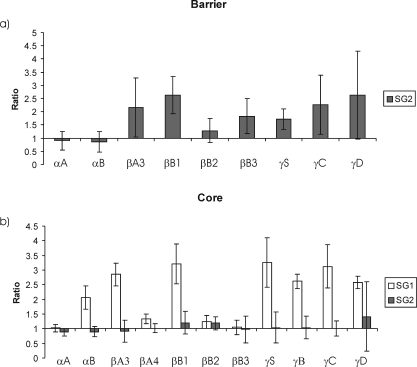
Figure 6.
Changes in the relative abundance of lens crystallins in (a) SG2 from the barrier region and (b) SG1 and SG2 from the core. The four-plex iTraq technology technique24 was used to compare the relative amount of each crystallin present in SG2 (or SG1 in b) from a 71- and a 72-year-old lens with the amount present in the same fraction isolated from a 49- and a 50-year-old lens. Error bars represent the combined SD between age groups from duplicate experiments. In this method of analysis, a value of 1 on the y-axis means that there has been no change in relative abundance of that protein between young and old groups. A value >1 indicates a larger relative amount of that polypeptide.

