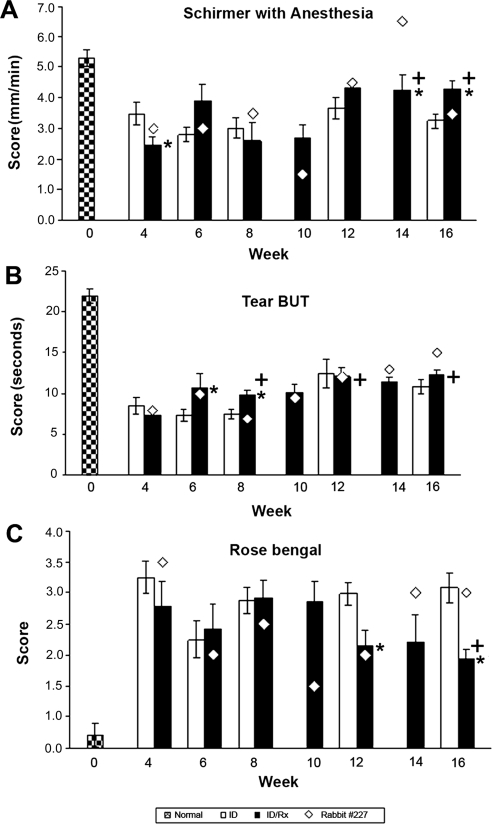
Figure 3.
Clinical ocular assessments. (A) Basal tear production. Schirmer test was performed on OD eyes of 16 rabbits (day 0). Stimulated lymphocytes from the autologous mixed-cell reactions were then injected into the remaining OD inferior LGs to induce disease. The LGs of the normal control group were not manipulated. To measure total tear production, a Schirmer strip was inserted in the lower fornix of OD eye for 1 minute, and the length of the wetted area of the strip was measured. Tear production was measured at indicated time points until 16 weeks after disease induction (further clarification for time points is given in Fig. 1). *P ≤ 0.05; statistically significant difference between the ID and ID/Rx animals at the indicated time points. P-values were calculated using independent sample t-tests. +P ≤ 0.05; significant differences between values for the AAV-treated animals at different times. P-values were calculated by paired t-test. (B) Tear break-up time (BUT) demonstrates tear instability. Group designations and statistical analyses were the same as for Figure 3A. BUT was evaluated by adding 5 μL of 2% fluorescein to the lower conjunctiva OD; the animal was allowed to blink several times to distribute the fluorescein on the cornea and was examined with a slit-lamp biomicroscope equipped with a blue filter. The time from opening of the eyes to the appearance of the first dry spot in the central cornea was measured three times, and the mean was recorded. (C) Rose Bengal. Designations for groups and statistical analyses are the same as in Figure 3A. Detection of deficiency in preocular tear film protection with Rose Bengal stain. Rose Bengal staining was assessed after the addition of 5 μL of 1% Rose Bengal solution to the OD lower conjunctiva. Results were recorded on a cornea diagram and scored using a standardized grading system.

