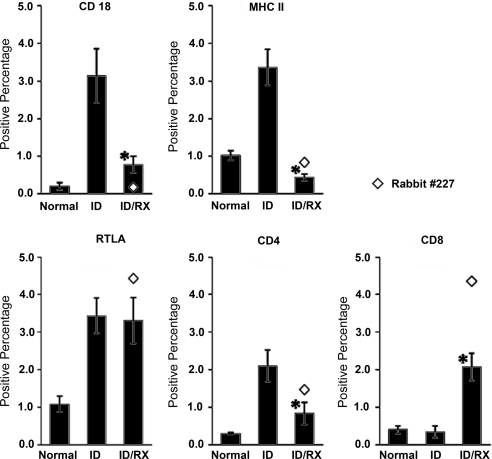
Figure 5.
LG sections from three study groups (normal, ID, ID/Rx) were stained for CD4, CD8, RTLA, CD18, and MHC II expression. For each marker studied, 16 to 24 sections per group were stained by the ABC method and analyzed by a cellular imaging system. Data are shown as mean ± SE positive percentage (i.e., area stained for specific antigen divided by total area of tissue scanned × 100 = positive percentage). *P ≤ 0.05; statistically significant difference between ID and ID/Rx animals.

