
Fig. 3.
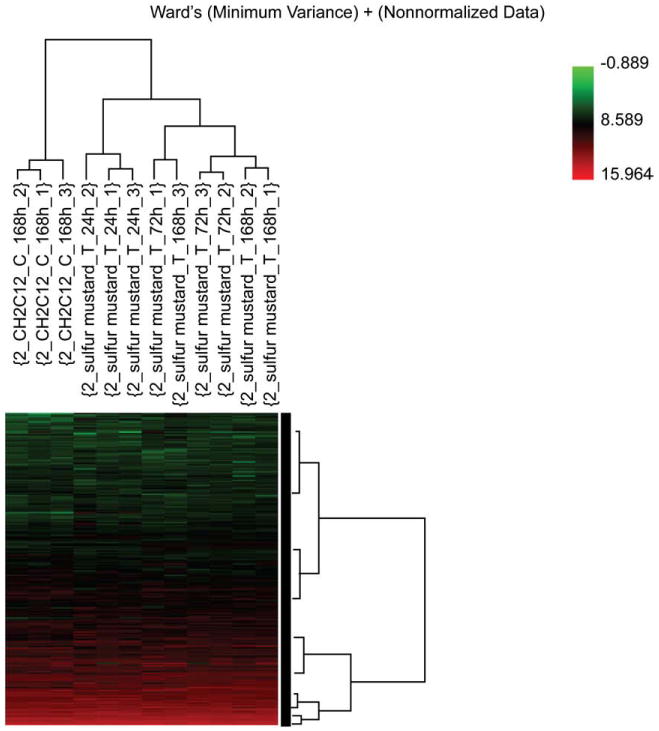
Hierarchical cluster analysis (HCA) based on 24,681 genes whose mean channel intensities were greater than 100 in the arrays. The control group separates from the SM-treated group, with an increasing distance with the time after dosing. This indicates an increasing number of genes are activated following SM-induced cutaneous injury.