
Fig. 7.
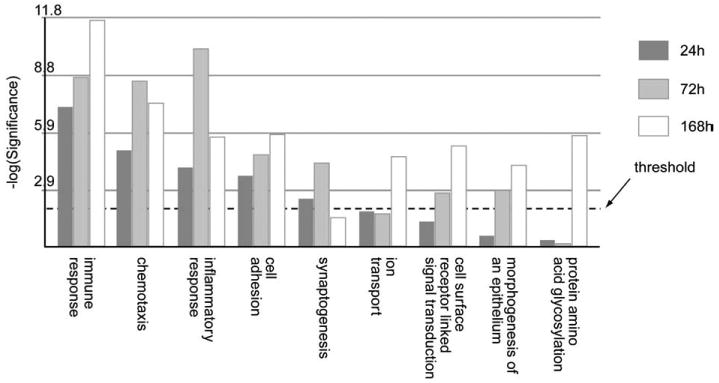
Comparison of biological processes obtained by Gene Ontology analysis whose gene expression was significantly altered by SM at 24 h, 72 h and 168 h respectively. The Y-axis represents the Fisher P value for each biological processes shown in the X-axis. The threshold value used for screening the pathways was a p-value of 0.01 (i.e. −log10(P)=2.0).