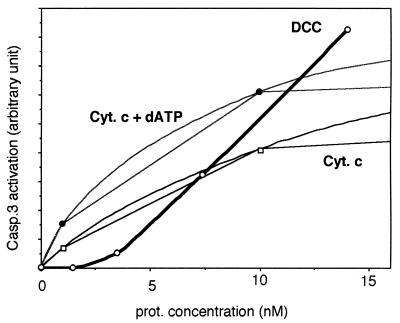
Figure 5.
Comparison of caspase-3 activation by DCC-IC versus cytochrome c. A dose-dependence analysis of DCC-induced caspase-3 activation was performed. In a similar in vitro assay as in Fig. 4, different quantities of DCC-IC or cytochrome c in the presence or not of 1 mM dATP were added. In the case of DCC-IC, the concentration was estimated based on comparison with purified protein (L.G. and P.M., unpublished data). Purified cytochrome c was used as attempts to activate caspase-3 in vitro with in vitro-translated cytochrome c were unsuccessful, probably as a result of the absence of the cytochrome c-associated heme (C.F. and P.M., unpublished results). The p20 cleavage fragment of caspase-3 was then detected by immunoblot and quantified by densitometry. A graph of the level of caspase-3 activation is presented.

