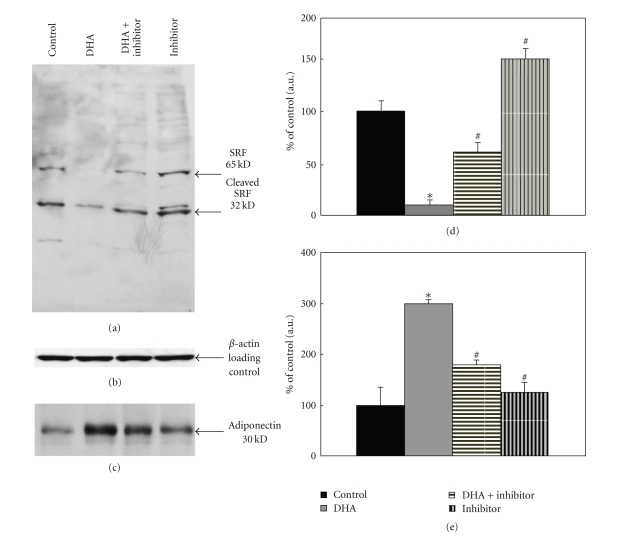
Figure 1.
Effects of DHA on SRF and adiponectin in 3T3-F442A adipocytes. 3T3-F442A adipocytes differentiated as described in Methods were treated with 25 μM DHA, 25 μM DHA plus 1.5 μM GW9662 or 1.5 μM GW9662 in DMEM containing 1% FBS for 16 h. Cells were lysed and separated on 10% SDS-PAGE followed by Western blotting with specific antibody. (a) Blots were analyzed with SRF C-terminus antibody. (d) Bar graph shows quantification using densitometric analysis of ≈65 kDa SRF protein. Data in the bar graph represents means of three independent experiments (*P < .025, # P < .05). (b) The same blot was analyzed with β-actin antibody to examine equal loading of proteins. (c) The same samples were also examined for the expression of adiponectin. Blots were probed with adiponectin antibody; bar graph shows quantitation of adiponectin protein using densitometric analysis and is expressed as percent of control. (e) Data in the bar graph represents means of three independent experiments (*P < .05, # P < .05).

