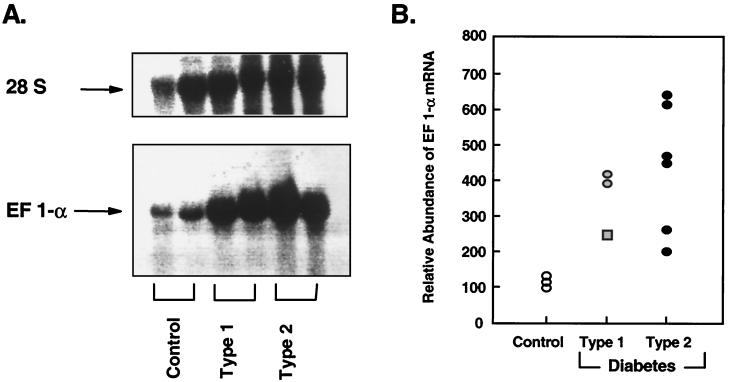
Figure 1.
Northern blot analysis of human skeletal muscle EF-1α mRNA. (A) Representative Northern blot of human skeletal muscle EF 1-α expression. Twenty micrograms of total RNA was extracted from two nondiabetic, two Type 1, and two Type 2 diabetic muscle samples, hybridized with labeled 1.2 kb cDNA insert of clone B10D6 (corresponding to human EF-1α cDNA), and autoradiographed. This blot shows a typical experiment. Upper shows that the amount of RNA loaded on the gels was equivalent in the different individuals based on reprobing of the blots with an oligonucleotide probe to human 28S RNA. (B) Relative abundance of the EF1-α mRNA. Twenty micrograms of total RNA was extracted from three nondiabetic, three Type 1, and six Type 2 diabetic muscle samples and hybridized with 1.2 kb cDNA insert of clone B10D6. Autoradiograms from several Northern blot analyses were quantified by scanning densitometry. The data were normalized to the integrated intensities of signals obtained from one nondiabetic RNA sample used as an internal standard. Each data point represents the mean of at least three determinations per RNA sample, except for the square data point, which represents one determination on a muscle sample of a Type 1 diabetic patient who had a pancreatic transplant several months before this study.

