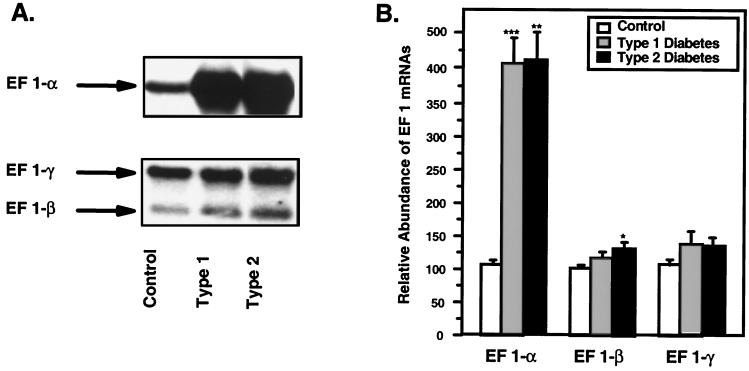
Figure 2.
Northern blot analysis of human skeletal muscle EF-1α, EF-1β and -γ mRNAs. (A) Representative Northern blot of human skeletal muscle EF 1-α, -β, and -γ expression. Twenty micrograms of total RNA was extracted from nondiabetic, Type 1, and Type 2 diabetic muscle samples, hybridized respectively with the cDNA insert from clone B10D6, EF 1-β, and -γ, and autoradiographed. (B) Relative abundance of the EF-1α, -β, and -γ mRNAs. Twenty micrograms of total RNA was extracted from three nondiabetic, two Type 1, and six Type 2 diabetic muscle samples and hybridized with EF-1α (B10D6), -β, and -γ cDNA probes. Autoradiograms from several Northern blot analyses were quantified separately by scanning densitometry, and the data were normalized to the integrated intensities of signals obtained from the same nondiabetic RNA sample used on all blots. The histograms represent the mean of the normalized values ± SEM. Statistical comparisons were made (against control values in each case) by using the unpaired Student's t test (***, P < 0.0001; **, P < 0.002; *, P < 0.05).

