Figure 3.
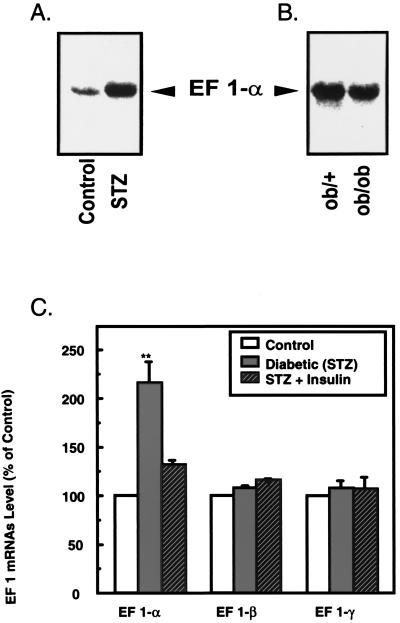
Comparative Northern blot analysis of EF-1α, -β, and -γ expression in hindlimb muscle from animal models of diabetes mellitus. (A) Representative analysis of EF-1α mRNA level in skeletal muscle of control and STZ-induced diabetic rats. (B) Representative analysis of EF-1α mRNA level in lean and genetically obese (ob/ob) mice. (C) Effect of diabetes mellitus and insulin therapy on EF-1 subunit expression in rat skeletal muscle. Twenty micrograms of total RNA was extracted from groups of control, diabetic, and insulin-treated diabetic rats (described in Table 1) and hybridized with random prime labeled cDNA probes for EF-1α (B10D6), -β, and -γ. Analysis of ribosomal RNA indicated that equal amounts of RNA were loaded onto each lane (not shown). Specific mRNAs were quantified from autoradiograms of several Northern blot analysis by laser-scanning densitometry relative to the amount in controls, which was assigned a value of 100. Data represent means ± SD from two or three separate experiments, each with at least two animals per group. Statistical comparisons were made by using the unpaired Student's t test (**, P < 0.002).

